Canva for CNS
Written by Arushi nath
Illustration by Arushi Nath
If you’ve ever stayed up late putting together a research poster or presentation slide deck for class, you know how painful it can be to make your work look halfway decent. Between resizing charts, formatting titles, and finding decent icons, it’s easy to spend more time designing than explaining your actual science. Luckily, UT Austin just made that process a lot easier. Thanks to a new partnership between UT and Canva, every student now has free access to Canva Premium, which is the full version of the design tool that’s usually paid. That means you can make professional quality graphics, research posters, study visuals, and org posters without paying a cent. For CNS students who spend hours turning dense data into something that actually makes sense, this partnership feels like a breath of fresh air. Canva Premium finally makes that creative side of science accessible without the headache of learning complicated design software.
Getting started with Canva Premium is pretty easy. All you need to do is head over to tech.utexas.edu and log in using your UT EID. Then, when you get to the home page, click “Explore Tech for students”. Then, scroll down and you should see the Canva Logo. Click on that, and it’ll take you directly to Canva’s site. From there, the software should automatically sign you in but if it does not, sign in using your eid or utexas.edu email and your account will automatically upgrade to Canva Premium. In less than a minute, you’ll have full access to Canva Premium, all covered by UT Austin.
When you open Canva after that, you’ll notice a whole new range of features. The background remover, animation tools, brand kit options, and premium fonts are now unlocked. You can upload your own fonts and collaborate with unlimited friends or lab partners in real time. If you already had a free Canva account under a personal email, you can switch it to your UT email in settings so you keep your old designs.
This new access can be incredibly empowering, though initially difficult to navigate. Instead of spending hours trying to make a figure look halfway presentable, you can focus on what actually matters. What’s cool about Canva is how flexible it is. It’s not just for posters or Instagram stories. For CNS students, it can fit right into the rhythm of our classes and projects. Whether you’re a biochem major trying to visualize enzyme pathways for research, in neuroscience summarizing your data, or in physics explaining oscillations, Canva gives you the tools to make your work impactful.
How CNS Students Can Apply Canva Premium
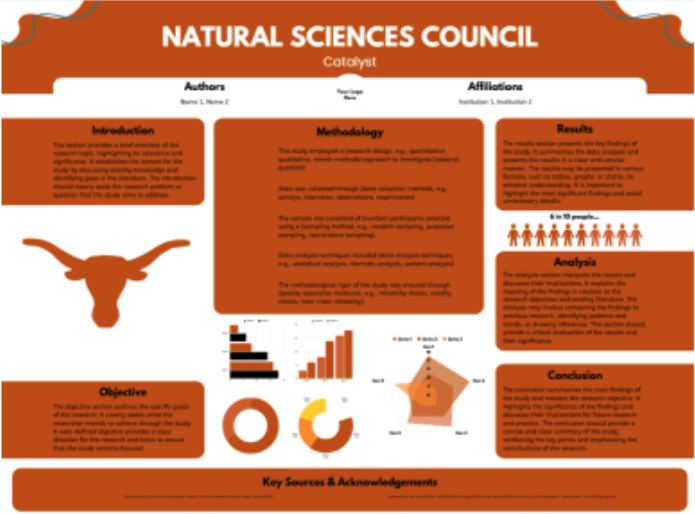
1. Research Posters & Presentations
If you’ve ever made a research poster, you know the struggle is real. Fitting all your figures, text, and graphs into one readable space is so difficult. Canva’s poster templates make that ten times easier. I used one of the “Scientific Research Poster” templates for my last project. It already had sections for “Methods,” “Results,” and “Conclusion,” and I just replaced the filler text with my data. You can upload graphs directly from Excel or Google Sheets, adjust colors to your lab or UT’s branding, and use Canva’s grid alignment tools to keep everything neat. The “Background Remover” tool is perfect if you want to clean up microscope images or experimental photos before adding them.
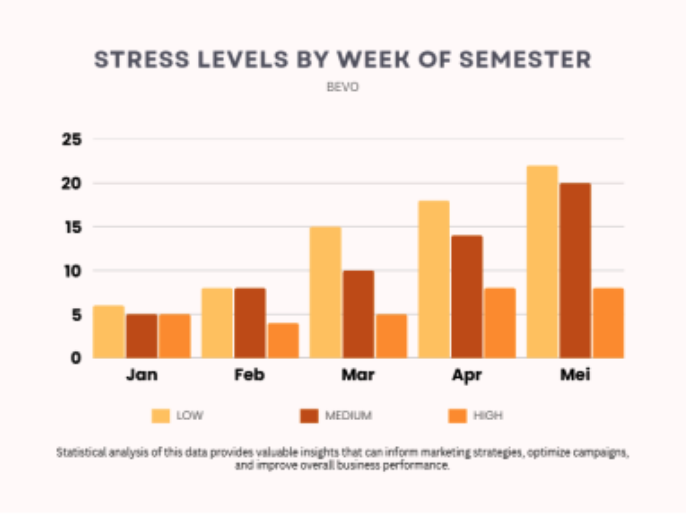
2. Data Visualization for Lab Reports
CNS majors live in data. It is the bread and butter of science and presentation matters. Canva’s chart maker lets you plug in your data and customize everything from axis labels to colors to make your figures stand out. You can even match your graphs to the color palette of your poster or slides so the whole thing looks cohesive. One trick I love is using Canva’s infographic elements (like arrows and icons) to annotate results instead of typing long explanations in your figure caption. Though it lets you make basic graphs and is perfect for design level visualizations (like things you’d put on a poster, infographic, or presentation where clarity and style matter more than deep statistical precision), it’s not built for scientific graphing. It cant add error bars, regression lines, or perform advanced data analysis. So for lab data, you’d still use Excel, GraphPad Prism, or R to make the graph first, then upload it into Canva to make it look clean.
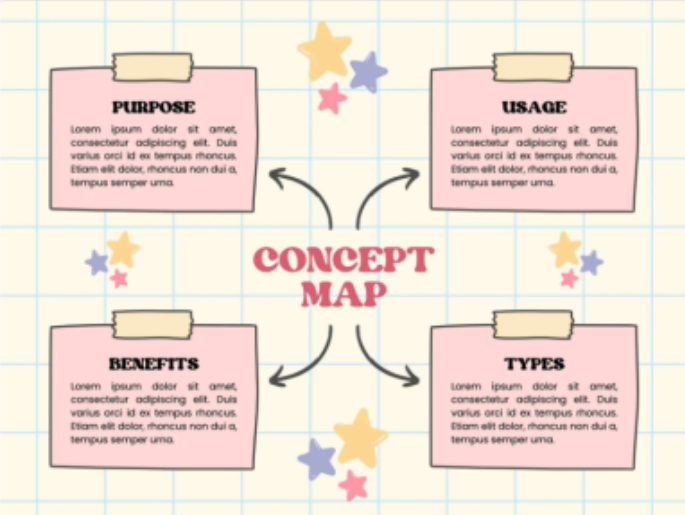
3. Study Aids & Concept Maps
Canva Premium is also a secret weapon for studying. You can create infographics or mind maps to summarize entire units. Use Canva’s “Education Infographic” templates, drag in icons for neurotransmitters or enzymes, and color code each step. Then, export the design as a phone wallpaper so you can review it between classes or just add it into your notes. I made one for the glycolysis pathway for my biochemistry class and it honestly helped me memorize reactions faster.
4. Group Projects & Lab Collaborations
If you’re working on a group presentation or a joint report, Canva’s shared editing feature saves a ton of time. In the past, I would make presentations on powerpoint, but it lacks many of the updated features of Canva. You and your partners can edit the same design at once, leave
comments, and assign sections. For organizing presentation slides, you can use Canva’s team folders to store all your figures in one place, so no one has to dig through messages to find them. It’s collaborative like Google Slides, but the results look way more polished.
5. Science Outreach & Communication
Many of us in CNS are involved in clubs or nonprofits, so you can also use Canva to communicate science beyond the classroom. If you’re making flyers for a health fair or infographics to explain your research to a general audience, Canva’s templates make it simple. For example, when designing a “Kidney Health Basics” flyer for a community event, I used Canva’s medical infographic template and swapped the icons for ones showing healthy foods and dialysis symbols. It took less than 30 minutes but looked like something from professional social media.
6. Career & Personal Branding
Finally, Canva can help when it’s time to apply for research positions, internships, or grad school. The resume and portfolio templates in Canva Premium let you show off your work cleanly. You can build a one page research portfolio with project visuals, or design a personal logo to make your application stand out. I even made a “scientific CV” infographic to show how my research, volunteering, and presentations connect. It's way more memorable than a standard Word doc.
Science is hard. Making it look good shouldn’t be. Between graphs that won’t align and slides that scream “default PowerPoint,” most of us could use a design miracle and UT just handed us one. With free Canva Premium for every student, turning your chaotic lab data into something people actually understand just got way easier. Science deserves to look as cool as it is, and now it finally can. At the end of the day, Canva’s not going to do your research for you, but it will make it look like you actually knew what you were doing. From posters to resumes to outreach flyers, it gives us the power to make science look as bold as it feels. Because if we’re going to spend hours in the lab or in class figuring out how our world works, our slides deserve to look a little less like chaos and a little more like discovery.